The Dishonest Distraction About The Dole

Welfare Money Does Not Disappear

Across Europe the debate about welfare spending tends to follow a predictable script. Governments warn about ballooning costs. Conservative politicians complain about incentives. Newspapers highlight the most extreme cases of abuse. The impression created is simple: the state hands money out, and the money is gone. This is even implied in the English word “dole.”

But economically, this picture is deeply misleading.
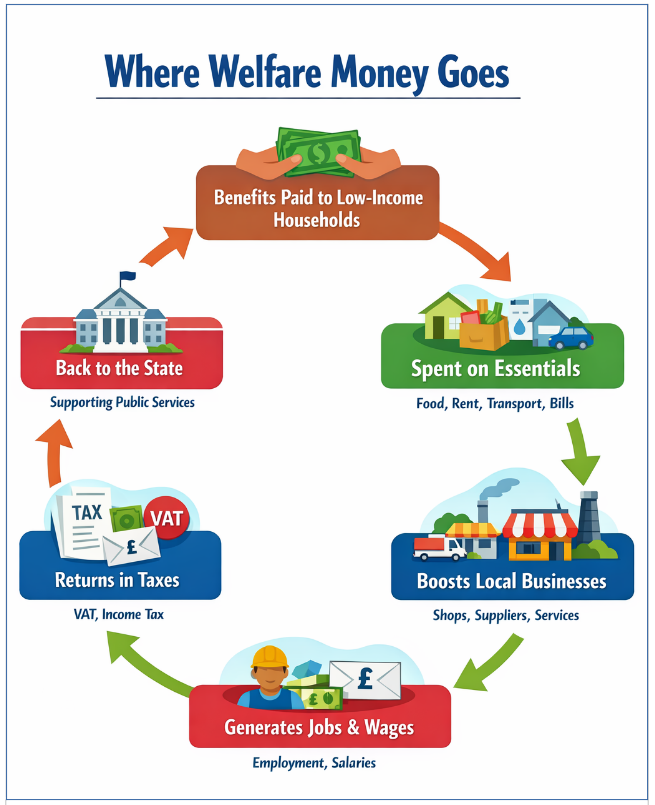
Money paid to low-income households does not disappear. It circulates through the economy, supports businesses, generates tax revenue and stabilises demand. A portion returns immediately to the state through consumption taxes. A larger portion sustains economic activity that would otherwise collapse.

Once this is understood, the political argument about welfare begins to look rather different.


The immediate return: consumption taxes

Across Europe, the final consumer pays VAT (or its equivalent). In Germany it is 19 percent; in the UK it is 20 percent; reduced rates apply to essentials such as food or children’s clothing.

When a low-income household spends welfare payments on groceries, toiletries, clothing, transport or household goods, a share of that spending flows straight back to the public purse.

This means welfare transfers are never purely one-way payments. Even before wider economic effects are considered, part of the money immediately returns to government.


The multiplier effect

The more important effect comes from how poorer households use money.

Economists describe this through the marginal propensity to consume — the proportion of additional income that is spent rather than saved.

Low-income households typically spend most or all of any extra income simply because they have to. Bills must be paid, food bought, and rent covered. Wealthier households, by contrast, are more likely to save additional income or invest it, taking advantage of tax incentives that reduce government income.

This matters because spending generates economic activity.

When a welfare recipient buys groceries:

    • the supermarket pays staff
    • suppliers receive orders
    • workers earn wages
    • those workers spend their own income

Taxes are paid at multiple stages — VAT, payroll taxes, corporate taxes.

Studies by organisations such as the International Monetary Fund and the OECD repeatedly find that transfers to poorer households produce relatively high fiscal multipliers. In simple terms, each euro or pound transferred can generate more than one euro or pound of economic activity.


The invisible stabiliser

This mechanism is why many European welfare systems act as automatic stabilisers during economic downturns.

When unemployment rises:

    • government spending increases
    • households retain some purchasing power
    • businesses retain customers

This prevents economic contractions from becoming deeper recessions.

Germany’s Kurzarbeit scheme during the COVID-19 crisis is an example of the same principle applied to wages. By subsidising reduced working hours instead of allowing mass layoffs, the government kept millions of workers connected to their employers and maintained consumer demand.

Income support, in other words, is often cheaper than economic collapse.


The Marxian shadow

None of this would have surprised Karl Marx. Marx argued that capitalist economies maintain what he called a “reserve army of labour” — a population that is unemployed or precariously employed, exerting downward pressure on wages and disciplining those who remain in work.

Whether one accepts Marx’s wider conclusions or not, the idea captures a persistent truth: labour markets always contain a margin of insecurity.

Welfare systems therefore operate at a delicate intersection. They prevent destitution while preserving enough economic pressure to keep labour markets functioning.

“The greater the social wealth, the functioning capital, the extent and energy of its growth… the greater is the industrial reserve army.”  — Karl Marx


The political misdirection

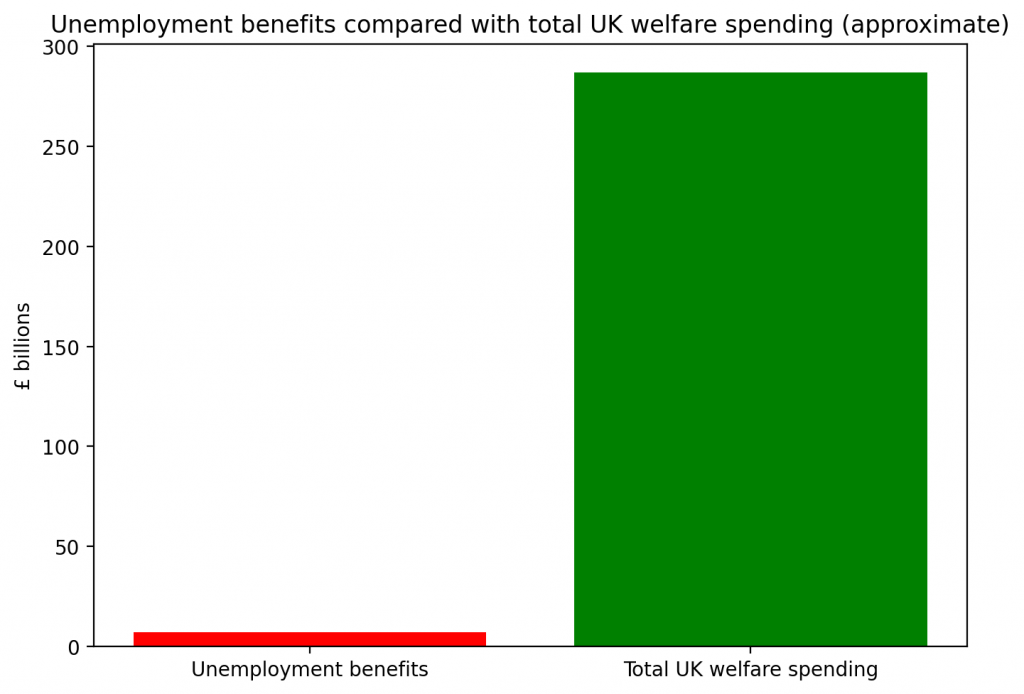
The numbers themselves reveal how distorted the debate often is.

In Germany, for example, spending on pensions alone exceeds €500 billion per year, while the Bürgergeld programme for the long-term unemployed accounts for only a small fraction of total social spending.
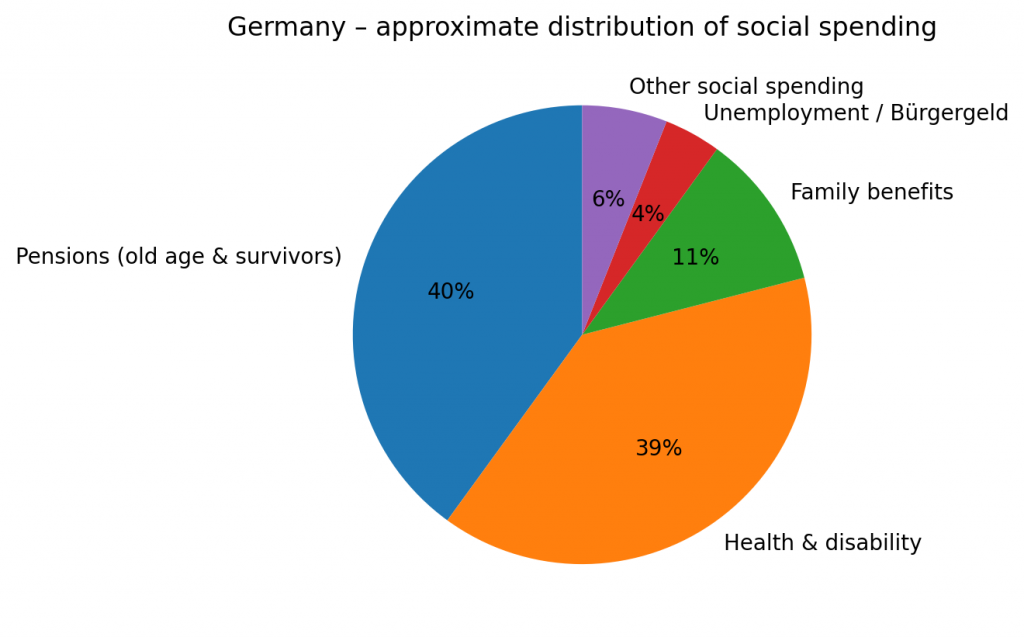
Yet political debates frequently focus obsessively on the latter.

Across Europe the pattern is similar: politically visible welfare programmes for the unemployed attract far more attention than the vastly larger costs associated with pensions, healthcare, demographic ageing and long-term care.

The result is a curious form of fiscal theatre. Here is the statistical reality in the UK:

The real question

If governments genuinely want fewer people dependent on welfare, the answer is not moral outrage. It is:

    • economic growth
    • functioning labour markets
    • effective training systems
    • efficient public administration
    • investment in education and skills

Until those foundations improve, the debate about welfare spending risks becoming little more than a ritualised complaint about the weakest participants in the economy, akin to refugees arriving in boats.


A more honest conversation

The welfare debate would look very different if it began with a simple act of honesty. Welfare money does not disappear. It circulates through shops, businesses, wages and tax systems before returning, partly and often quickly, to the state itself.

The real fiscal pressures facing European governments lie elsewhere: ageing populations, pensions, healthcare and the long-term costs of economic stagnation. Yet political attention continues to circle obsessively around the smallest slice of the welfare state. Perhaps that is because it is easier to argue about the poor than to confront the deeper structural challenges of a modern economy.

The ideas of economists and political philosophers, both when they are right and when they are wrong, are more powerful than is commonly understood.                — John Maynard Keynes

Six Countries, One Question: Who Actually Knows How to Run a Modern State?

The puzzle we keep arguing about

Political debate in the West is strangely repetitive.

We argue about whether governments spend too much.
We argue about whether welfare states are affordable.
We argue about whether taxes are already too high.

What we almost never do is step back and ask a more structural question:

What does a successful modern state actually look like on both sides of the ledger?

Over the past weeks I have been comparing six very different countries:

    • United Kingdom
    • Germany
    • Spain
    • Finland
    • United States
    • India

Looking not at slogans, but at the underlying fiscal architecture:

    • Where governments actually spend their money
    • Where they actually get it from
    • And how coherently the two sides fit together

What emerges is not ideological. It is mathematical.

What the spending side reveals

Start with expenditure.

Across all advanced economies in this comparison, one fact stands out immediately:

Modern states already spend most of their money on the social foundations of economic life.

In different proportions, but with striking consistency, the largest items are:

    • Pensions and social protection
    • Health
    • Education

Even in the United States, public spending is heavily concentrated in these areas.

The real differences between countries are not about whether they fund a social state.

They are about how coherently and efficiently they do it.

Compare three cases.

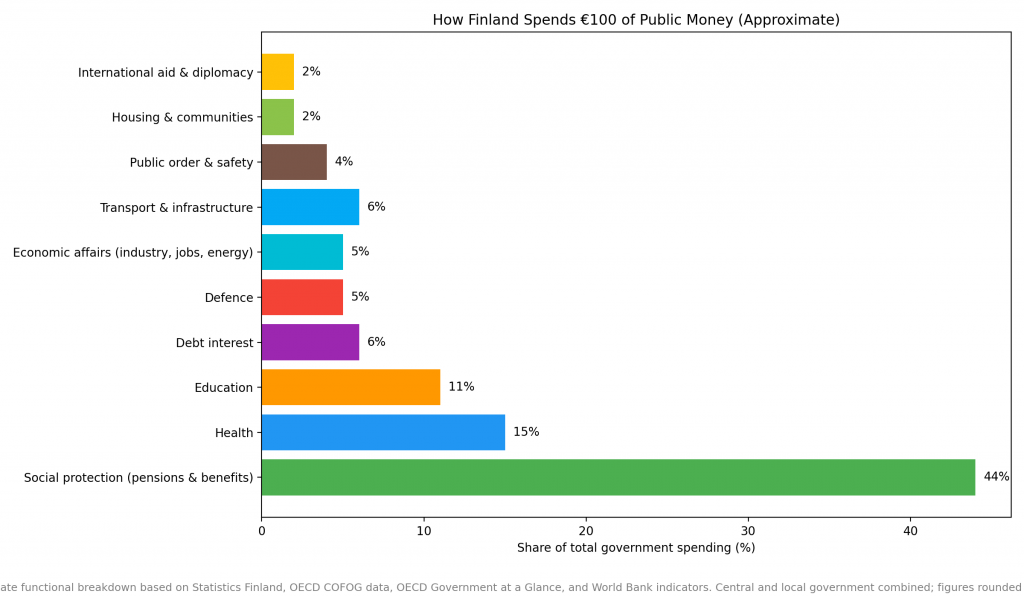
Finland represents the clean Nordic model:

    • Social protection is dominant
    • Health and education are heavily funded
    • Defence and debt interest remain contained

Nothing here is accidental. The spending profile is internally consistent and politically normalised.

Now contrast that with the United Kingdom.

The UK spends in recognisably European patterns — heavy on welfare and health — but with noticeably tighter margins and more visible fiscal strain.

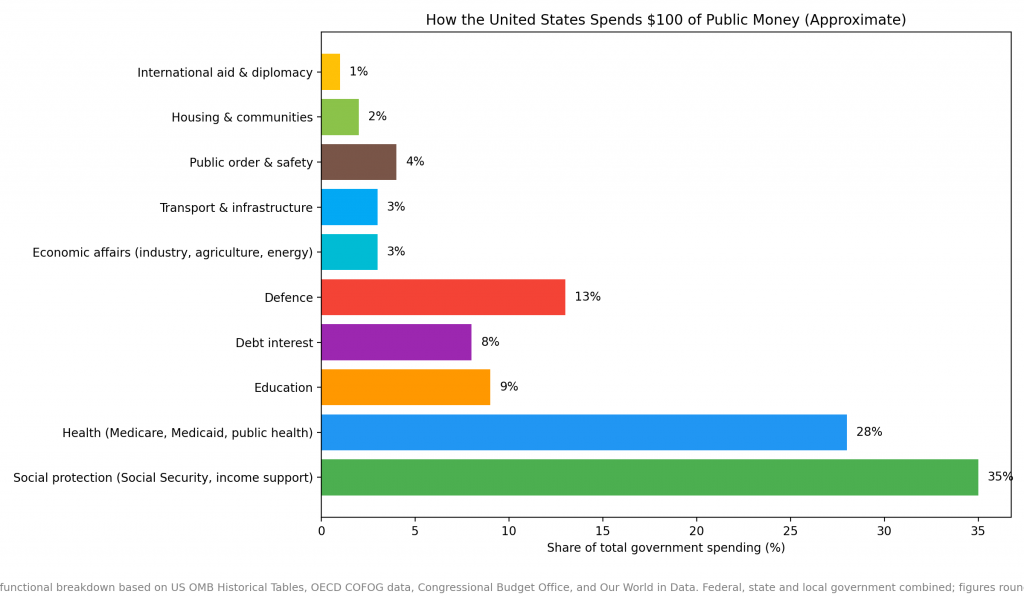
And then there is the United States.

The US looks different in one crucial respect: defence and health together absorb an unusually large share of public money.

But the bigger insight is this:

On the spending side alone, most rich democracies look more similar than political rhetoric would suggest.

To understand why outcomes diverge, we have to look at the other half of the state.

The side we almost never discuss: how states raise the money

Public debate obsesses over spending.

But the real dividing line between successful and strained states lies on the revenue side.

When we map where governments actually get their money, the picture sharpens dramatically.

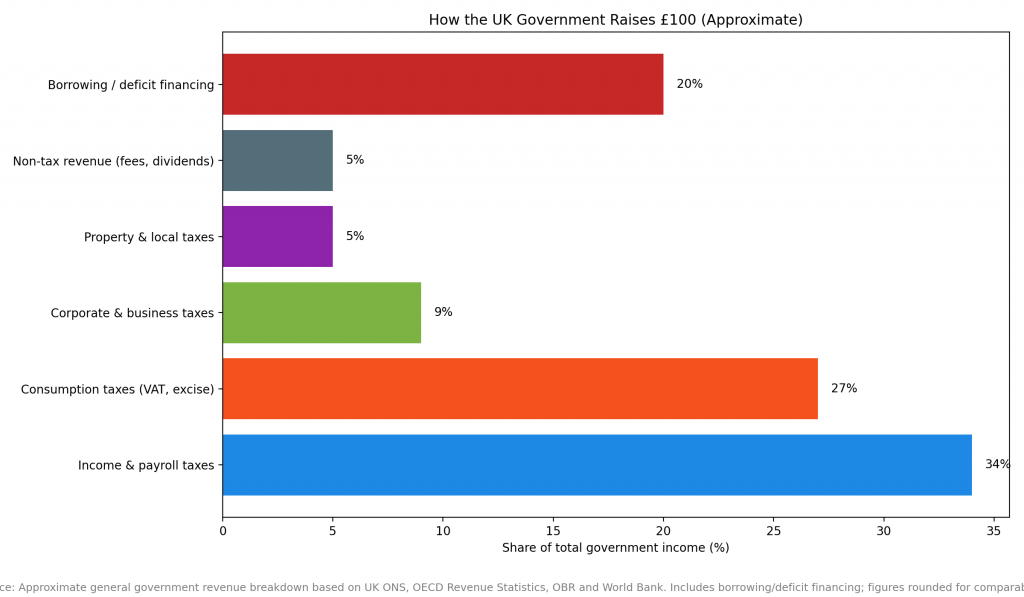
The United Kingdom raises most of its revenue from:

    • Income and payroll taxes
    • Consumption taxes (especially VAT)

But one feature stands out:

Borrowing plays a structurally large role.

In other words, part of the British state is routinely financed with future money.

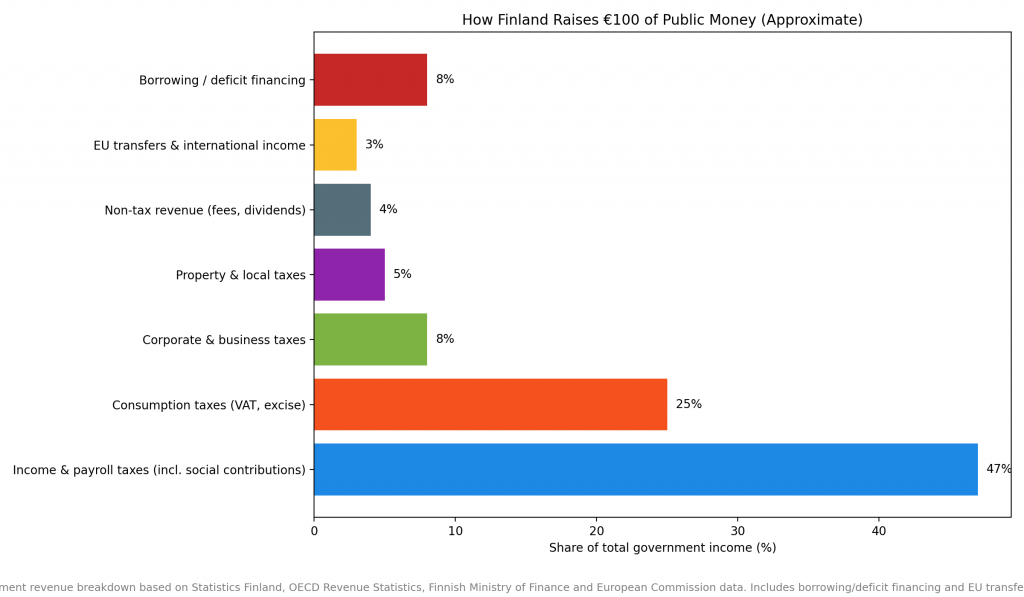
Now compare Finland.

Here the architecture is strikingly different.

Finland funds its state primarily through:

    • Broad income and payroll taxation
    • Strong but not dominant consumption taxes
    • Limited reliance on borrowing

The key point is not that taxes are higher.

It is that the system is broad, balanced and paid for largely in real time.

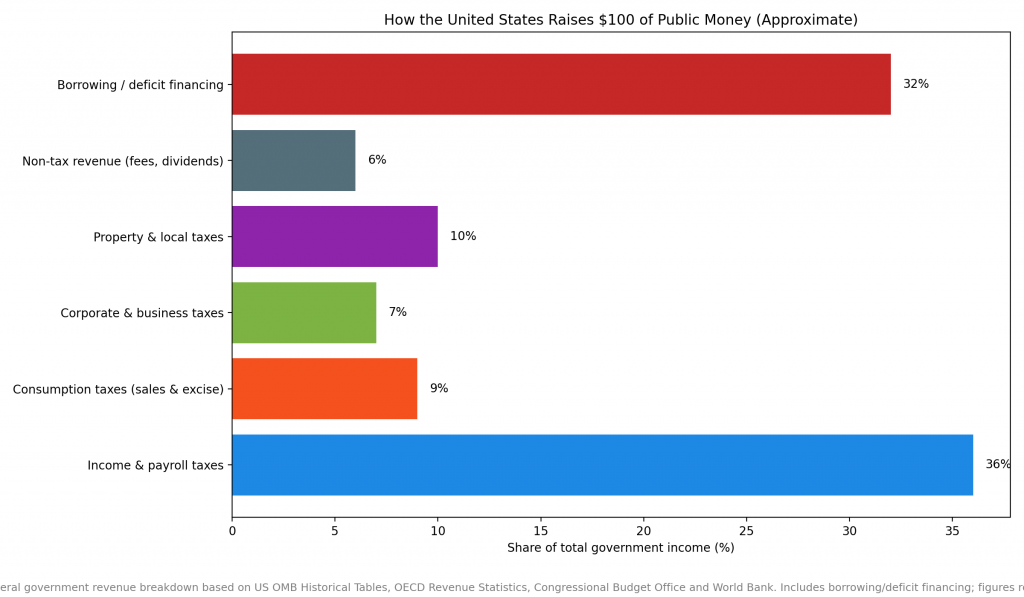
Finally, the United States.

This is where the structural paradox becomes impossible to ignore.

The US has:

    • No national VAT
    • A relatively narrow tax base
    • Heavy dependence on borrowing

Roughly speaking, the American state is financed partly by something no other country in this comparison can rely on at scale: the global demand for US government debt.

The real dividing line

At this point the pattern becomes clear.

The question is not:

Who spends the most?

It is:

Who has built a revenue system capable of sustainably funding what they have promised?

In this six-country comparison, three broad models emerge.

The Nordic coherence model (Finland)

    • Broad tax base
    • High social trust
    • Strong upfront funding
    • Limited structural borrowing

Result: high social provision with relatively low fiscal drama.

The continental industrial model (Germany, partly Spain)

    • Strong payroll contributions
    • Embedded welfare financing
    • Export-supported tax base
    • Result: durable but dependent on continued industrial strength.

The Anglo-American fragility model (UK and US)

    • Narrower tax bases
    • Political resistance to broad taxation
    • Greater reliance on borrowing

Result: permanent fiscal anxiety despite comparable spending commitments.

India, meanwhile, represents something different again: not excess, but constraint — a state still expanding its tax capacity while carrying significant debt burdens.

So which model actually works best?

If we strip away culture, history, and political rhetoric — an artificial exercise, but a revealing one — the evidence points in a consistent direction.

The countries that most successfully combine:

    • economic competitiveness
    • high employment
    • strong social protection
    • and fiscal stability

tend to share three features:

First, they fund their social state broadly and visibly through taxation rather than chronically through borrowing.

Second, they treat health, education, and social protection not as residual costs but as core economic infrastructure.

Third, they minimise fragmentation and administrative leakage in how public money flows through the system.

In my six-country comparison, the model closest to this balance is the Nordic one, particularly Finland’s.

This does not mean it is easily transplantable.

But it does suggest something important.

The uncomfortable implication

If the arithmetic is this clear, why is the model so rare?

Because the barriers are not primarily technical.

They are political and psychological.

A fully coherent modern state requires:

    • broad-based taxation
    • high social trust
    • willingness to pay upfront
    • and political systems capable of explaining the trade-offs honestly

Many democracies struggle with precisely these conditions.

It is easier to argue about spending than to redesign revenue.
Easier to promise services than to build the tax base that sustains them.
Easier to borrow than to explain who must pay, and how.

But the underlying mathematics does not go away.

And the countries that align both sides of the ledger most cleanly are, increasingly, the ones that govern with the least fiscal drama.

Next question: not whether the Nordic model can be copied wholesale — it cannot — but which elements of fiscal design travel well across very different political systems.

“The difficulty lies not so much in developing new ideas as in escaping from old ones.”
— John Maynard Keynes

The Elephant in the British Room: Why There Is Always Money for War, but Never for Care

Over the past decade, British governments have repeatedly demonstrated that fiscal limits are flexible. When spending is framed as urgent, unavoidable, or tied to national security, the state borrows freely and at scale. When spending concerns education, healthcare, or the living standards of poorer pensioners, we are told, with equal confidence, that there is no money.

The contradiction is not hidden. It is simply normalised.


The fiction of scarcity

The UK does not suffer from an absolute inability to spend. It suffers from a selective definition of what counts as affordable. Public borrowing is not rejected in principle; it is filtered by legitimacy.

Debt incurred for defence, border enforcement, or security infrastructure is framed as realism, regrettable but necessary in a dangerous world. Debt incurred to maintain schools, fund care, or prevent old-age poverty is framed as indulgence, risk, or irresponsibility.

This distinction is not economic. It is rhetorical and moral. Once embedded, it removes priorities from democratic debate and replaces them with a language of inevitability.


Where the money goes

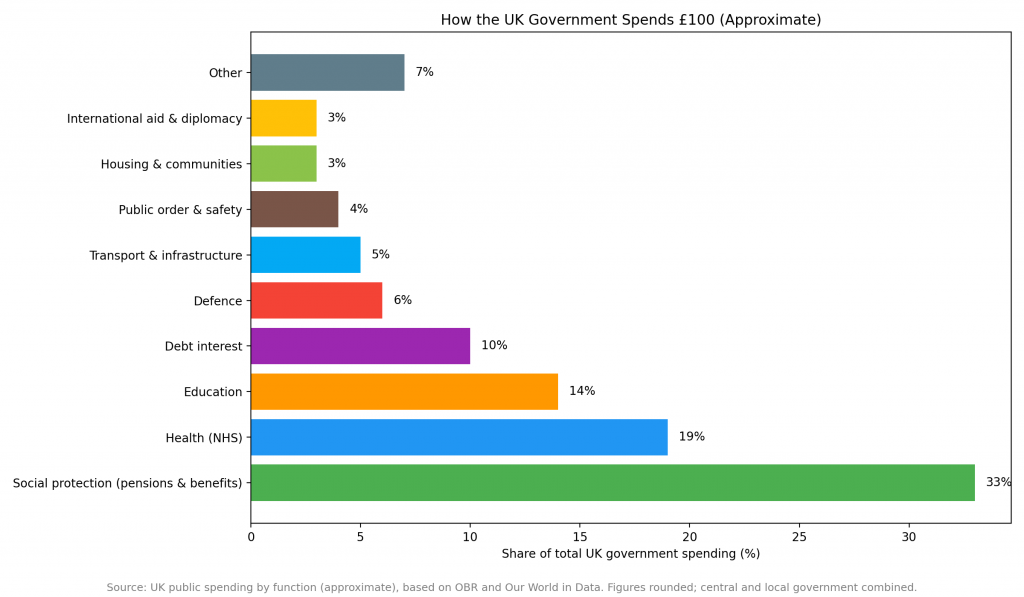
The overall structure of UK government spending already tells part of the story.

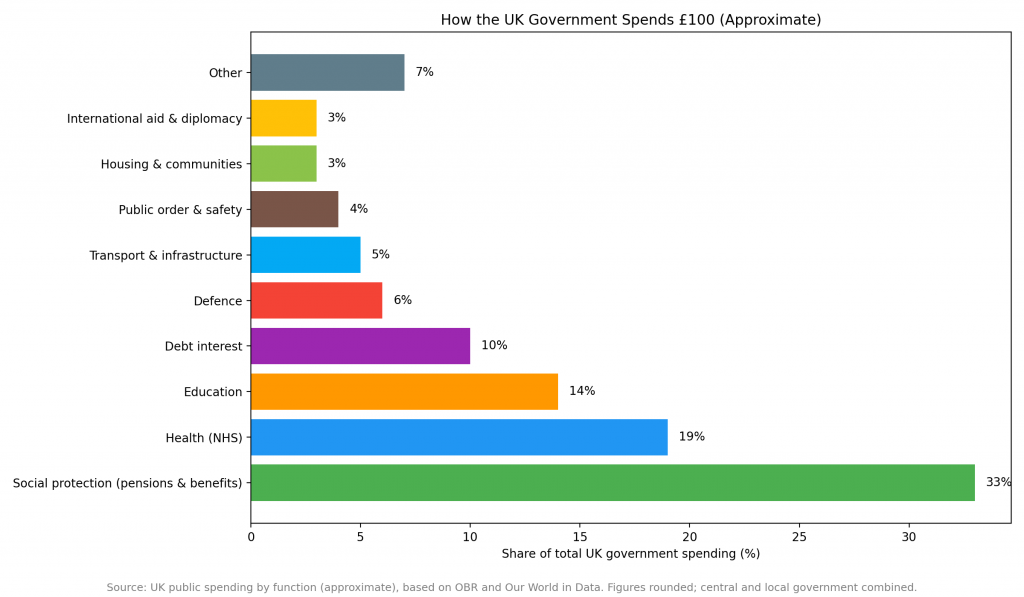
How the UK government spends £100 (approximate).
Based on OBR, HM Treasury, and Our World in Data. Figures rounded; central and local government combined.

At first glance, the picture appears balanced. Social protection, healthcare, and education account for a substantial share of spending. Defence, by contrast, is not the largest item.

But this is precisely where the debate often goes wrong. The issue is not whether defence dominates the budget. It is which areas of spending are treated as politically untouchable.

One category in the chart deserves particular attention: debt interest. A significant share of public money now goes simply to servicing past decisions, producing no public services at all. Yet even this is treated as unavoidable, while investments in human and social infrastructure are endlessly questioned.


What is protected over time

To understand political priorities, we need to look not just at levels of spending, but at what is protected from decline.

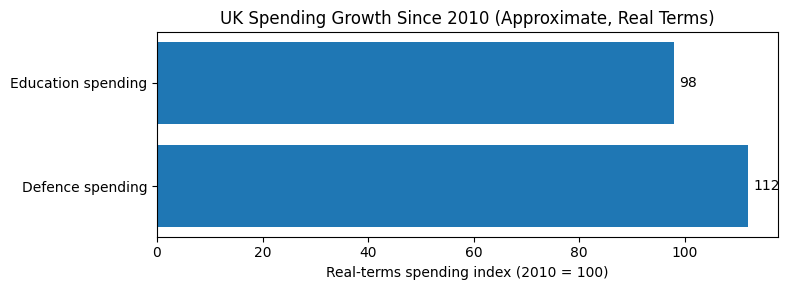
UK spending growth since 2010 (real terms, index: 2010 = 100).
Approximate indices based on Treasury, IFS, and OBR data; figures rounded for clarity.

Since 2010, UK defence spending has grown modestly in real terms. Education spending has failed even to keep pace with inflation.

This divergence matters. Growth here does not imply excess, nor does stagnation imply neglect by accident. It reflects which areas of public life are shielded from erosion, and which are allowed to decline quietly, year after year.

Defence is treated as structurally non-negotiable. Education is treated as adjustable.


Managed distraction and political theatre

This hierarchy of priorities is sustained by a wider political and media environment that rarely lingers on structural questions.

Public attention is instead drawn toward asylum boats, royal scandals, party infighting, leadership personalities, tactical U-turns, and culture-war skirmishes. Each may be newsworthy in isolation, but together they form a fog, absorbing outrage while larger financial commitments pass with limited scrutiny.

While headlines fixate on spectacle, long-term spending decisions are presented as technical necessities rather than political choices. Defence increases are framed as serious and sober. Social spending is framed as contentious, expensive, or unrealistic.


What “we can’t afford it” really means

The phrase “we can’t afford it” has become a shorthand for this does not rank high enough. It signals which forms of harm the state is willing to tolerate, and which it is determined to prevent.

In contemporary Britain, the harms associated with underfunded care, deteriorating schools, and pensioner poverty are treated as regrettable but acceptable. The risks associated with under-spending on defence or control are treated as intolerable.


The issue that remains

The real test of a society is not what it claims it cannot afford, but what it never seriously debates cutting.

Until this issue is faced honestly, debates about affordability will continue to obscure what is really at stake. The elephant will remain in the room: visible, substantial, and politely ignored.

“Budgets are moral documents.”
— Jim Wallis


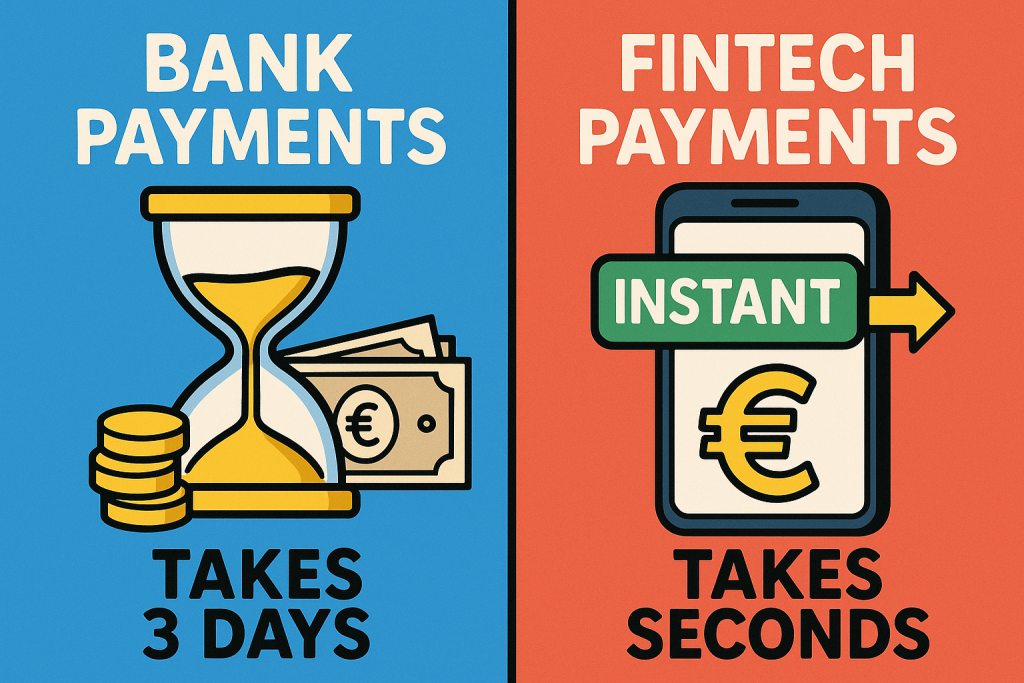
Why Did Banks Need Three Days to Move Your Money? They Didn’t.

For decades, banks told us that transferring money takes three working days. It sounded reasonable — until fintech arrived and proved it was never about technology at all.


🏦 The Myth of “Processing Time”

For most of modern banking history, delays were justified by “overnight clearing” or “batch processing.” Customers were told that money needed time to “settle.”

But by the 1990s, computers were perfectly capable of real-time transactions. Internal transfers within the same bank were often instant — yet balances were still held back. The reason wasn’t technical; it was institutional.


💰 The Real Reason: The Float

The float — the period between debit from one account and credit to another — generated billions in hidden profits. While your funds were “in transit,” they sat in pooled accounts earning overnight interest for the bank.

For the customer, that money was already gone. For the bank, it was still working — quietly compounding returns day after day.


🧑‍⚖️ Political Inertia and Banking Lobbying

When consumer groups and policymakers began demanding faster payments, large financial institutions pushed back.

They claimed instant payments would increase fraud risk and require costly system upgrades. Governments, often reliant on bank stability and liquidity, accepted the argument.

The result: decades of delay disguised as “prudence,” while customers unknowingly financed the system’s inefficiency.


💡 Fintech Breaks the Illusion

Everything changed when fintech challengers like N26, Revolut, and Wise (formerly TransferWise) arrived. Their apps moved money instantly — sometimes across borders — and at transparent, near-zero cost.

Customers began asking the obvious question:

“If I can send money abroad in seconds, why does my domestic transfer still take days?”

That question broke the spell.


🇪🇺 Europe Finally Acts

The European Union responded with the Second Payment Services Directive (PSD2) and the SEPA Instant Credit Transfer (SCT Inst) system.

    • Launched: 2017
    • Mandated: 2024, with full compliance required by 2025–26

Under this law, all EU banks must offer instant euro transfers 24/7 at no extra charge.

Even conservative institutions like Santander, Barclays, and Deutsche Bank have now adopted instant payments, finally aligning with what fintechs proved was possible years ago.


🌍 A Global Shift Toward Real-Time Banking

    • United Kingdom: Introduced Faster Payments in 2008 — a major step forward. Initially, some banks charged modest fees; today, most domestic transfers are free for personal accounts.
    • India: The Unified Payments Interface (UPI), launched in 2016, made instant transfers completely free and is now used by over a billion people.
    • Brazil: PIX, launched in 2020, offers 24/7 real-time transfers — also free for individuals and a fraction of the cost for businesses.
    • United States: Only caught up in 2023 with the Federal Reserve’s FedNow service, which is still rolling out gradually.

⏳ The Lesson: Time as Currency

For decades, banks didn’t need three days to move your money — they needed three days to make money from your money.

Fintechs exposed the fiction. The new laws merely confirm what the technology had shown all along: that time, like capital, belongs to those who create it.

“It is difficult to get a man to understand something, when his salary depends upon his not understanding it.” — Upton Sinclair